Overview
LibreNMS is a great network device monitoring system, and Grafana is a wonderful tool for visualising and alerting on data from multiple sources.
Both are great examples of open-source software that you should be considering for your environment.
However, while LibreNMS does provide official integration with many external databases that you can then use as a data source in Grafana, if you don’t already have one of these in your environment it requires you to deploy these as well.
I’ve also personally run into performance issues with the Prometheus Pushgateway integration when pushing a large number of metrics, probably because Pushgateway isn’t designed for that use case.
Recently I stumbled upon a Reddit post by user /u/wjhinz which described a method for “(almost) natively” using LibreNMS as a data source in Grafana by using RRDReST as an API endpoint to access the RRD files that LibreNMS creates.
After testing this and confirming it works very well, I wanted to add to the Reddit post by documenting what a containerised deployment of this solution looks like.
Major kudos to both /u/tbotnz (for their work on RRDReST) and /u/wjhinz (for documenting this solution).
Containerised Deployment
LibreNMS
I’ll be using Docker Compose for this deployment, and starting with the LibreNMS docker example compose file as the base.
I’ve trimmed some services that aren’t needed (mstpd, syslog and SNMP traps), and included my compose file in an appendix section.
RRDReST
Next, we want to add an RRDReST container. As a container image doesn’t currently exist, we will need to create one.
Thanks to tbotnz, who has provided instructions on how to get RRDReST running in his Github repository, creating a container image is relatively easy.
Here’s the Dockerfile I’ve written:
FROM python:3.10-alpine
RUN apk add g++ make rrdtool
COPY requirements.txt /opt/RRDReST/requirements.txt
WORKDIR /opt/RRDReST
RUN pip3 install -r requirements.txt
COPY . /opt/RRDReST
ENTRYPOINT ["uvicorn", "rrdrest:rrd_rest"]
CMD ["--host", "0.0.0.0", "--port", "9000"]
I’ve built the container using this and pushed it to be pulled from Docker Hub as well.
To add this to our deployment, we simply need to add another service to the docker-compose.yml file and give the container access to the LibreNMS volume (so it can read the RRD files).
I’m using /opt/librenms as the mount point for the volume, as it mimics where data would be located in a non-containerised deployment.
services:
  ...
  rrdrest:
    image: michaelwadman/rrdrest:latest
    container_name: rrdrest
    volumes:
      - "./librenms:/opt/librenms"
As /u/wjhinz notes in their post, RRDReST needs read access to the RRD files, which should be fine with a docker-compose set up like this, but could be a good place to start investigations if it isn’t working for you.
Grafana
Finally, we want to add a Grafana container.
services:
  ...
  grafana:
    image: grafana/grafana-oss:latest
    container_name: grafana
    ports:
      - target: 3000
        published: 3000
        protocol: tcp
    environment:
      - "GF_INSTALL_PLUGINS=marcusolsson-json-datasource"
Note that I’m adding an environment variable for the installation of the JSON API plugin, as this is needed to interact with both the LibreNMS API as well as the RRDReST API.
docker-compose up
With a complete compose file, we can spin up the environment:
$ sudo docker-compose up -d
Creating network "librenms_grafana_default" with the default driver
Creating librenms            ... done
Creating grafana             ... done
Creating librenms_db         ... done
Creating librenms_dispatcher ... done
Creating librenms_redis      ... done
Creating librenms_memcached  ... done
Creating rrdrest             ... done
Adding data sources in Grafana
Creating LibreNMS user
To add LibreNMS as a data source in Grafana, we first need to create an API token in LibreNMS.
Visit the LibreNMS web interface and log in (in my case, “http://127.0.0.1:8000”, with the default credentials of librenms/librenms).
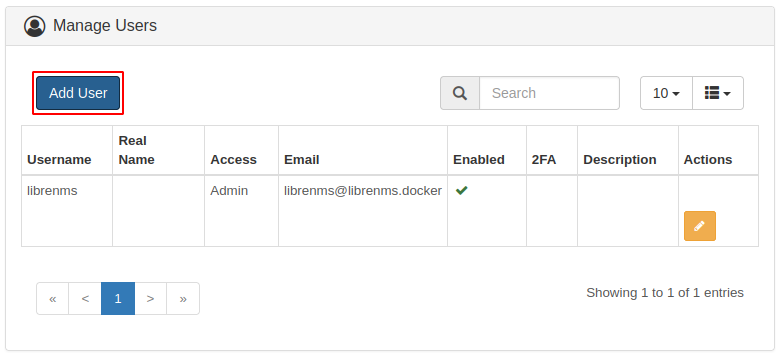
Because Grafana will only require read access, we’re going to create a new user with read-only access and then associate the token we create with that user.
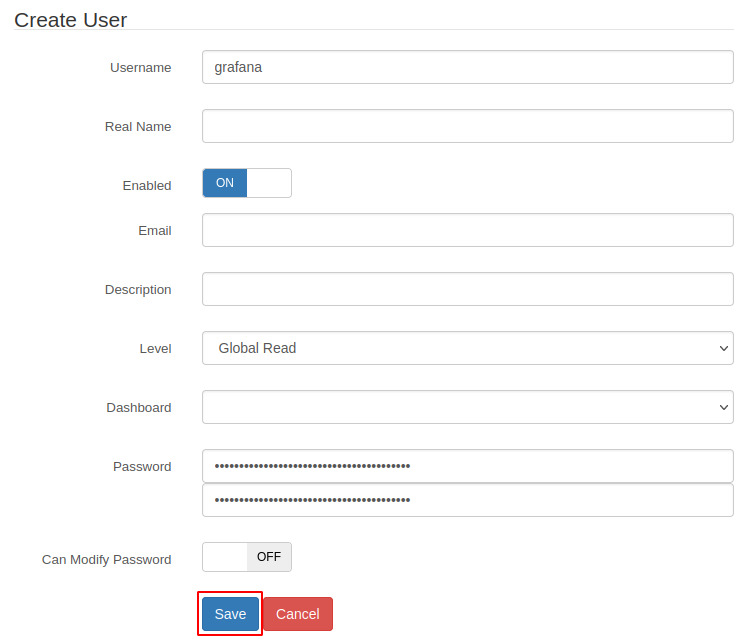
Under ‘Settings -> Manage Users’, I created a user named “grafana”, changed the access level to “Global Read” and set a random password as we will only be using the API access.
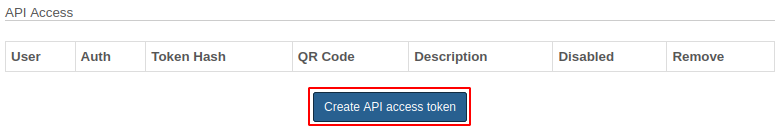
Then, under ‘Settings -> API -> API Settings’, I created an API token for the grafana user:
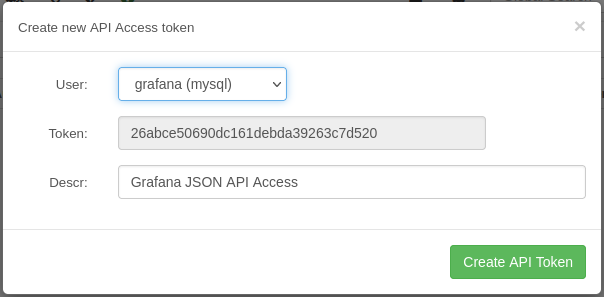
Make sure to copy the token when creating it, as we’ll need that later when adding the data source into LibreNMS.
Adding LibreNMS data source in Grafana
After logging into the Grafana web interface (in my case, “http://127.0.0.1:3000”, with the default credentials of admin/admin), navigate to ‘Configuration -> Data Sources’ from the left pane.
Add a new data source and select the JSON API type from the list.
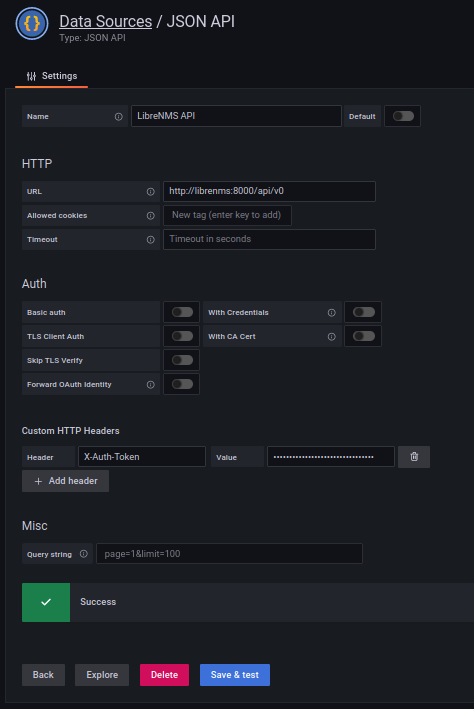
In the settings for the LibreNMS API data source, we need to change the URL and add the token authentication header.
The URL should be set to your LibreNMS host and port, with the API endpoint of “/api/v0” appended.
Then, under “Custom HTTP Headers”, select “Add Header”. The header name will be “X-Auth-Token” and the value will be the token string that you created above.
Save and test that the API endpoint is working for you, and you should get a green “Success” pop-up if everything is working.
My data source looked like the following when finished:
Adding RRDReST data source in Grafana
Like the above, we’re going to also add the RRDReST API as a new data source in Grafana too.
This will also be a JSON API, so select this from the data source type when creating it.
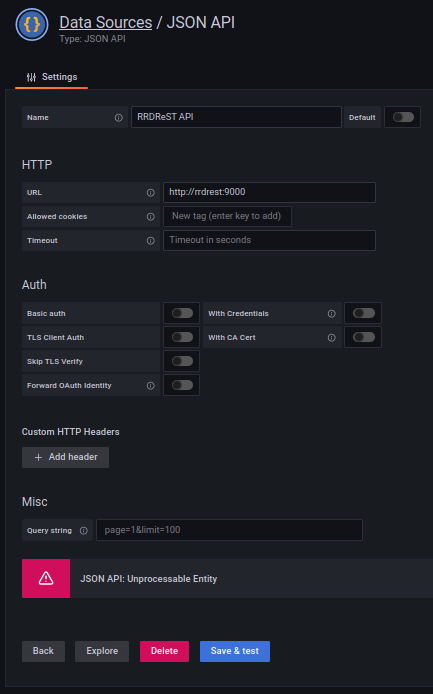
In the settings for the RRDReST API data source, we only need to change the URL.
Again, point this towards your RRDReST container host and port, and leave the endpoint blank.
Save and test that the API endpoint is working for you, and you should get a red “Unprocessable Entity” pop-up if everything is working. This error means the API is reachable, but the plugin can’t process the data returned (which is expected, because there isn’t any data returned, as we haven’t pointed it to an RRD file yet).
My data source looked like the following when finished:
Creating a dashboard
The last thing to do is to create a dashboard for the LibreNMS data to be visualised.
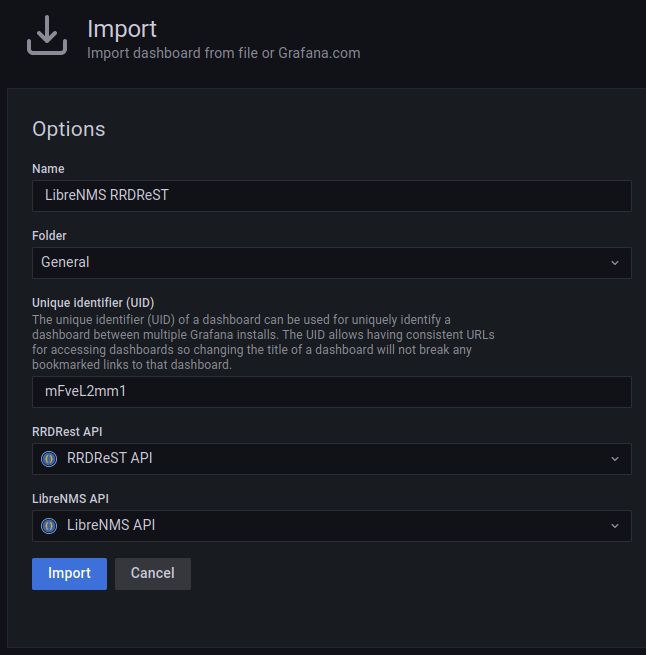
From the left pane in Grafana, select ‘Create -> Import’ and then upload the JSON file created by /u/wjhinz on Pastebin. I’ve also included it in an appendix section below in the case that the Pastebin link goes away for some reason.
After import, you’ll be prompted to name the dashboard, place it into a folder and select the data sources you created before. Here’s what mine looked like before import:
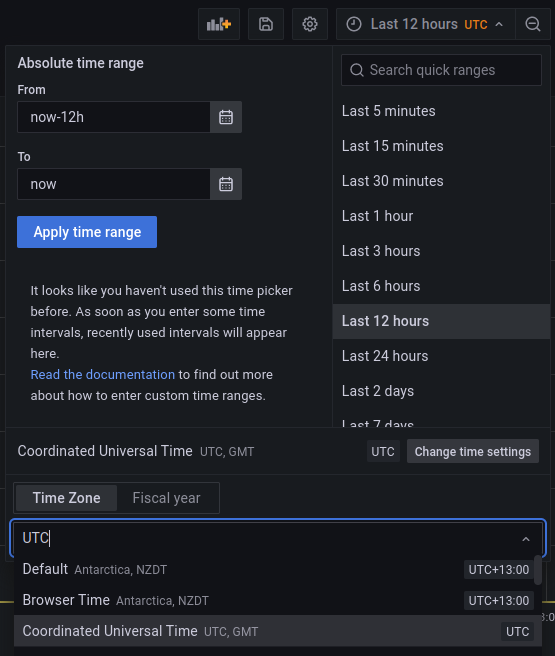
There was one last item that I needed to change to get data displayed on the graph panels, which was to set the timezone to UTC. I believe this is needed because LibreNMS stores (or RRDReST represents) data in UTC format, but Grafana queries it with the local browser timezone by default.
To do so, drop-down the time picker from the top right of the dashboard screen, select “Change Time Settings” and choose UTC.
If you’ve got devices in LibreNMS, they should appear up the top left of the page in a drop down menu along with a list of interfaces. After selecting a device and an interface, both the “Bandwidth In/Out” and “Errors In/Out” graphs will populate with information:
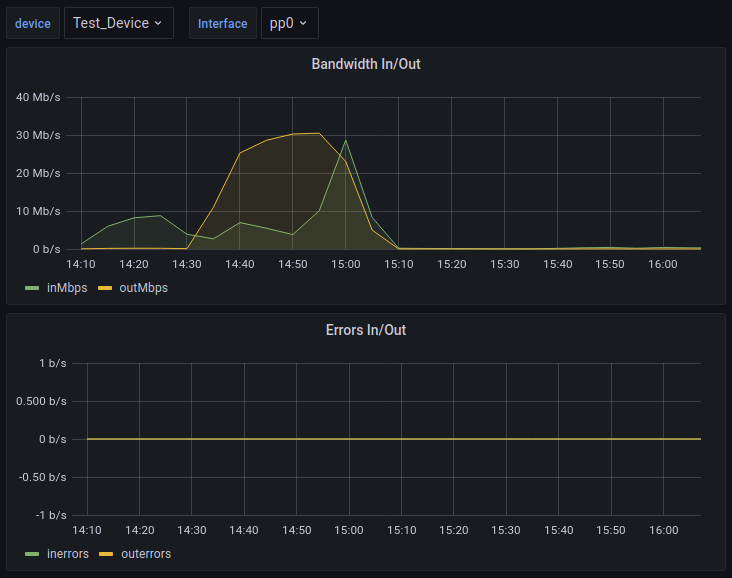
While the panels in the dashboard provided only show port throughput and errors, it’s pretty easy to pick up the other RRD files in a device directory and display those statistics as well.
For example, LibreNMS has created 64 other RRD files full of stats for my test device:
$ sudo docker exec -it rrdrest ls /opt/librenms/rrd/
Test_Device
$ sudo docker exec -it rrdrest ls /opt/librenms/rrd/Test_Device/ | grep -v port | wc -l
64
Conclusion
Providing RRDReST access to the RRD files that LibreNMS creates is not only easy, but it performs well too.
If you are already using Grafana in your environment to visualise, analyse and/or alert on data in a centralised fashion, then pulling SNMP metrics in through LibreNMS (and its’ device discovery feature) from devices that are otherwise unmonitored and using RRDReST as a data source is a great “quick win”.
Appendices
References
wjhinz’s Reddit Post
RRDReST Repository
RRDReST Container Image
Grafana JSON API Data source Plugin
Versions used
Desktop Machine: Ubuntu 20.04
Docker: 20.10.12
Docker Compose: 1.26.2
LibreNMS: 21.11.0
Grafana: 8.3.3
Full Code
Docker Compose file
version: "3.5"

services:
  db:
    image: mariadb:10.5
    container_name: librenms_db
    command:
      - "mysqld"
      - "--innodb-file-per-table=1"
      - "--lower-case-table-names=0"
      - "--character-set-server=utf8mb4"
      - "--collation-server=utf8mb4_unicode_ci"
    volumes:
      - "./db:/var/lib/mysql"
    environment:
      - "TZ=Pacific/Auckland"
      - "MYSQL_ALLOW_EMPTY_PASSWORD=yes"
      - "MYSQL_DATABASE=librenms"
      - "MYSQL_USER=librenms"
      - "MYSQL_PASSWORD=asupersecretpassword"
    restart: always

  memcached:
    image: memcached:alpine
    container_name: librenms_memcached
    environment:
      - "TZ=Pacific/Auckland"
    restart: always

  redis:
    image: redis:5.0-alpine
    container_name: librenms_redis
    environment:
      - "TZ=Pacific/Auckland"
    restart: always

  librenms:
    image: librenms/librenms:latest
    container_name: librenms
    hostname: librenms
    cap_add:
      - NET_ADMIN
      - NET_RAW
    ports:
      - target: 8000
        published: 8000
        protocol: tcp
    volumes:
      - "./librenms:/data"
    environment:
      - "TZ=Pacific/Auckland"
      - "PUID=1000"
      - "PGID=1000"
      - "DB_HOST=db"
      - "DB_NAME=librenms"
      - "DB_USER=librenms"
      - "DB_PASSWORD=asupersecretpassword"
      - "DB_TIMEOUT=60"
      - "REDIS_HOST=redis"
      - "REDIS_PORT=6379"
      - "REDIS_DB=0"
      - "MEMORY_LIMIT=256M"
      - "UPLOAD_MAX_SIZE=16M"
      - "OPCACHE_MEM_SIZE=128"
      - "REAL_IP_FROM=0.0.0.0/32"
      - "REAL_IP_HEADER=X-Forwarded-For"
      - "LOG_IP_VAR=remote_addr"
      - "MEMCACHED_HOST=memcached"
      - "MEMCACHED_PORT=11211"
      - "LIBRENMS_WEATHERMAP=false"
    restart: always

  dispatcher:
    image: librenms/librenms:latest
    container_name: librenms_dispatcher
    hostname: librenms-dispatcher
    cap_add:
      - NET_ADMIN
      - NET_RAW
    volumes:
      - "./librenms:/data"
    environment:
      - "TZ=Pacific/Auckland"
      - "PUID=1000"
      - "PGID=1000"
      - "DB_HOST=db"
      - "DB_NAME=librenms"
      - "DB_USER=librenms"
      - "DB_PASSWORD=asupersecretpassword"
      - "DB_TIMEOUT=60"
      - "DISPATCHER_NODE_ID=dispatcher1"
      - "REDIS_HOST=redis"
      - "REDIS_PORT=6379"
      - "REDIS_DB=0"
      - "SIDECAR_DISPATCHER=1"
      - "MEMORY_LIMIT=256M"
      - "UPLOAD_MAX_SIZE=16M"
      - "OPCACHE_MEM_SIZE=128"
      - "REAL_IP_FROM=0.0.0.0/32"
      - "REAL_IP_HEADER=X-Forwarded-For"
      - "LOG_IP_VAR=remote_addr"
      - "MEMCACHED_HOST=memcached"
      - "MEMCACHED_PORT=11211"
      - "LIBRENMS_WEATHERMAP=false"
    restart: always

  rrdrest:
    image: michaelwadman/rrdrest:latest
    container_name: rrdrest
    volumes:
      - "./librenms:/opt/librenms"

  grafana:
    image: grafana/grafana-oss:latest
    container_name: grafana
    ports:
      - target: 3000
        published: 3000
        protocol: tcp
    environment:
      - "GF_INSTALL_PLUGINS=marcusolsson-json-datasource"
Grafana Dashboard JSON
{
  "__inputs": [
    {
      "name": "DS_RRDREST_API",
      "label": "RRDRest API",
      "description": "",
      "type": "datasource",
      "pluginId": "marcusolsson-json-datasource",
      "pluginName": "JSON API"
    },
    {
      "name": "DS_LIBRENMS_API",
      "label": "LibreNMS API",
      "description": "",
      "type": "datasource",
      "pluginId": "marcusolsson-json-datasource",
      "pluginName": "JSON API"
    }
  ],
  "__requires": [
    {
      "type": "grafana",
      "id": "grafana",
      "name": "Grafana"
    },
    {
      "type": "panel",
      "id": "graph",
      "name": "Graph",
      "version": ""
    },
    {
      "type": "datasource",
      "id": "marcusolsson-json-datasource",
      "name": "JSON API",
      "version": "1.2.1"
    }
  ],
  "annotations": {
    "list": [
      {
        "builtIn": 1,
        "datasource": "-- Grafana --",
        "enable": true,
        "hide": true,
        "iconColor": "rgba(0, 211, 255, 1)",
        "name": "Annotations & Alerts",
        "type": "dashboard"
      }
    ]
  },
  "editable": true,
  "gnetId": null,
  "graphTooltip": 0,
  "id": null,
  "iteration": 1626152089476,
  "links": [],
  "panels": [
    {
      "aliasColors": {},
      "bars": false,
      "dashLength": 10,
      "dashes": false,
      "datasource": "${DS_RRDREST_API}",
      "fieldConfig": {
        "defaults": {
          "custom": {},
          "unit": "bps"
        },
        "overrides": []
      },
      "fill": 1,
      "fillGradient": 0,
      "gridPos": {
        "h": 15,
        "w": 24,
        "x": 0,
        "y": 0
      },
      "hiddenSeries": false,
      "id": 2,
      "legend": {
        "avg": false,
        "current": false,
        "max": false,
        "min": false,
        "show": true,
        "total": false,
        "values": false
      },
      "lines": true,
      "linewidth": 1,
      "nullPointMode": "null",
      "options": {
        "alertThreshold": true
      },
      "percentage": false,
      "pluginVersion": "7.3.5",
      "pointradius": 2,
      "points": false,
      "renderer": "flot",
      "seriesOverrides": [],
      "spaceLength": 10,
      "stack": false,
      "steppedLine": false,
      "targets": [
        {
          "body": "",
          "cacheDurationSeconds": 0,
          "fields": [
            {
              "jsonPath": "$.data[*].time",
              "name": "time",
              "type": "time"
            },
            {
              "jsonPath": "$.data[*].inoctets",
              "name": "inoctets",
              "type": "number"
            },
            {
              "jsonPath": "$.data[*].outoctets",
              "name": "outoctets",
              "type": "number"
            }
          ],
          "hide": false,
          "method": "GET",
          "params": [
            [
              "",
              ""
            ]
          ],
          "queryParams": "",
          "refId": "A",
          "urlPath": "?rrd_path=/opt/librenms/rrd/$device/port-id$portid.rrd&epoch_start_time=${__from:date:seconds}&epoch_end_time=${__to:date:seconds}"
        }
      ],
      "thresholds": [],
      "timeFrom": null,
      "timeRegions": [],
      "timeShift": null,
      "title": "Bandwidth In/Out",
      "tooltip": {
        "shared": true,
        "sort": 0,
        "value_type": "individual"
      },
      "transformations": [
        {
          "id": "calculateField",
          "options": {
            "alias": "inMbps",
            "binary": {
              "left": "inoctets",
              "operator": "*",
              "reducer": "sum",
              "right": "8"
            },
            "mode": "binary",
            "reduce": {
              "include": [
                "inoctets"
              ],
              "reducer": "lastNotNull"
            },
            "replaceFields": false
          }
        },
        {
          "id": "calculateField",
          "options": {
            "alias": "outMbps",
            "binary": {
              "left": "outoctets",
              "operator": "*",
              "reducer": "sum",
              "right": "8"
            },
            "mode": "binary",
            "reduce": {
              "reducer": "sum"
            },
            "replaceFields": false
          }
        },
        {
          "id": "filterFieldsByName",
          "options": {
            "include": {
              "names": [
                "time",
                "inMbps",
                "outMbps"
              ]
            }
          }
        }
      ],
      "type": "graph",
      "xaxis": {
        "buckets": null,
        "mode": "time",
        "name": null,
        "show": true,
        "values": []
      },
      "yaxes": [
        {
          "$$hashKey": "object:1546",
          "format": "bps",
          "label": null,
          "logBase": 1,
          "max": null,
          "min": null,
          "show": true
        },
        {
          "$$hashKey": "object:1547",
          "format": "short",
          "label": null,
          "logBase": 1,
          "max": null,
          "min": null,
          "show": true
        }
      ],
      "yaxis": {
        "align": false,
        "alignLevel": null
      }
    },
    {
      "aliasColors": {},
      "bars": false,
      "dashLength": 10,
      "dashes": false,
      "datasource": "${DS_RRDREST_API}",
      "fieldConfig": {
        "defaults": {
          "custom": {},
          "unit": "bps"
        },
        "overrides": []
      },
      "fill": 1,
      "fillGradient": 0,
      "gridPos": {
        "h": 15,
        "w": 24,
        "x": 0,
        "y": 15
      },
      "hiddenSeries": false,
      "id": 3,
      "legend": {
        "avg": false,
        "current": false,
        "max": false,
        "min": false,
        "show": true,
        "total": false,
        "values": false
      },
      "lines": true,
      "linewidth": 1,
      "nullPointMode": "null",
      "options": {
        "alertThreshold": true
      },
      "percentage": false,
      "pluginVersion": "7.3.5",
      "pointradius": 2,
      "points": false,
      "renderer": "flot",
      "seriesOverrides": [],
      "spaceLength": 10,
      "stack": false,
      "steppedLine": false,
      "targets": [
        {
          "body": "",
          "cacheDurationSeconds": 0,
          "fields": [
            {
              "jsonPath": "$.data[*].time",
              "name": "time",
              "type": "time"
            },
            {
              "jsonPath": "$.data[*].inerrors",
              "name": "inerrors",
              "type": "number"
            },
            {
              "jsonPath": "$.data[*].outerrors",
              "name": "outerrors",
              "type": "number"
            }
          ],
          "hide": false,
          "method": "GET",
          "params": [
            [
              "",
              ""
            ]
          ],
          "queryParams": "",
          "refId": "A",
          "urlPath": "?rrd_path=/opt/librenms/rrd/$device/port-id$portid.rrd&epoch_start_time=${__from:date:seconds}&epoch_end_time=${__to:date:seconds}"
        }
      ],
      "thresholds": [],
      "timeFrom": null,
      "timeRegions": [],
      "timeShift": null,
      "title": "Errors In/Out",
      "tooltip": {
        "shared": true,
        "sort": 0,
        "value_type": "individual"
      },
      "transformations": [],
      "type": "graph",
      "xaxis": {
        "buckets": null,
        "mode": "time",
        "name": null,
        "show": true,
        "values": []
      },
      "yaxes": [
        {
          "$$hashKey": "object:1546",
          "format": "bps",
          "label": null,
          "logBase": 1,
          "max": null,
          "min": null,
          "show": true
        },
        {
          "$$hashKey": "object:1547",
          "format": "short",
          "label": null,
          "logBase": 1,
          "max": null,
          "min": null,
          "show": true
        }
      ],
      "yaxis": {
        "align": false,
        "alignLevel": null
      }
    }
  ],
  "refresh": "30s",
  "schemaVersion": 26,
  "style": "dark",
  "tags": [],
  "templating": {
    "list": [
      {
        "allValue": null,
        "current": {},
        "datasource": "${DS_LIBRENMS_API}",
        "definition": "$.devices[*].hostname",
        "error": null,
        "hide": 0,
        "includeAll": false,
        "label": null,
        "multi": false,
        "name": "device",
        "options": [],
        "query": {
          "cacheDurationSeconds": 300,
          "fields": [
            {
              "jsonPath": "$.devices[*].hostname"
            }
          ],
          "method": "GET",
          "queryParams": "",
          "urlPath": "/devices"
        },
        "refresh": 1,
        "regex": "",
        "skipUrlSync": false,
        "sort": 0,
        "tagValuesQuery": "",
        "tags": [],
        "tagsQuery": "",
        "type": "query",
        "useTags": false
      },
      {
        "allValue": null,
        "current": {},
        "datasource": "${DS_LIBRENMS_API}",
        "definition": "$.ports[*].port_id",
        "error": null,
        "hide": 0,
        "includeAll": false,
        "label": "Interface",
        "multi": false,
        "name": "portid",
        "options": [],
        "query": {
          "cacheDurationSeconds": 300,
          "experimentalVariableTextField": "ifName",
          "experimentalVariableValueField": "id",
          "fields": [
            {
              "jsonPath": "$.ports[*].port_id",
              "name": "id"
            },
            {
              "jsonPath": "$.ports[*].ifName",
              "name": ""
            }
          ],
          "method": "GET",
          "queryParams": "",
          "urlPath": "/devices/$device/ports?columns=ifName%2Cport_id"
        },
        "refresh": 1,
        "regex": "",
        "skipUrlSync": false,
        "sort": 0,
        "tagValuesQuery": "",
        "tags": [],
        "tagsQuery": "",
        "type": "query",
        "useTags": false
      }
    ]
  },
  "time": {
    "from": "now-12h",
    "to": "now"
  },
  "timepicker": {},
  "timezone": "utc",
  "title": "LibreNMS RRDReST",
  "uid": "mFveL2mm1",
  "version": 28
}